The government published its latest response to public concerns about ‘storm overflows’ in August – although it seems to be saying that 2020 is the baseline and that discharges will be possible until 2050:
“by 2025, water companies will have reduced overflows discharges from 2020 levels by around 25%.”
“By 2035, water companies will have: improved all overflows discharging into or near every designated bathing water; and improved 75% of overflows discharging to high priority sites.”
“By 2050, no storm overflows will be permitted to operate outside of unusually heavy rainfall or to cause any adverse ecological harm.”
Storm_Overflows_Discharge_Reduction_Plan.pdf
Meanwhile, Thames Water, one of the highest culprits when it comes to ‘storm discharges’ is letting its customers know when it happens:
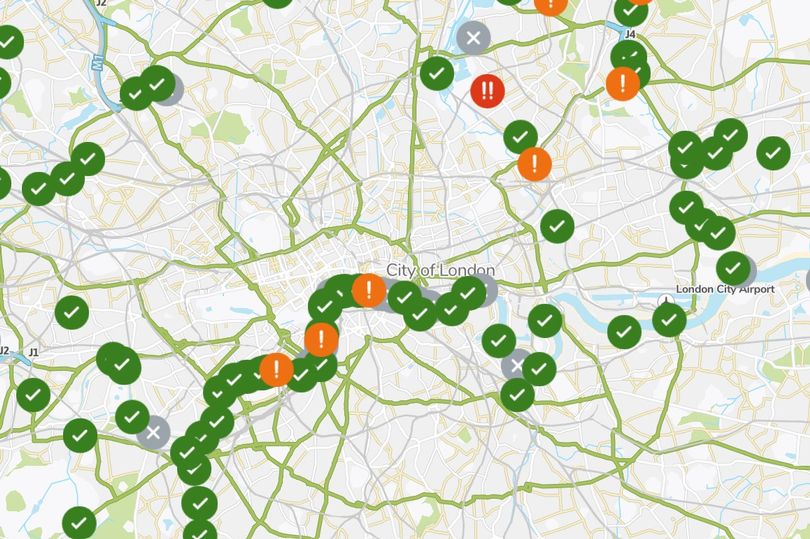
Thames Water map shows exactly where sewage is being dumped in London as it happens – MyLondon
As for the South West Water area, Surfers Against Sewage are able to provide information:
10 beauty spots in Dorset where sewage has been discharged – Dorset Live
We also know what the sewage discharges [Combined sewer overflows (CSOs)] are – thanks to this interactive map:
Are you a river defender? Interested in taking a deeper dive into the data. If you want to download a report of spills in your constituency, this tool is for you.
Download | Is my river fit to play in?
There are also the measurements taken by the Water Monitoring Group of the SVBG – but strictly for chemical composition rather than pollution:
How much sewage is ending up in the Sid? part two – The Sid
Trying to get better data about discharges into our rivers – The Sid